Montreal weather covers more ground than most visitors expect: January averages −9 °C with windchill that can feel below −40, July afternoons average 27 °C with humidity that can push the “feels like” figure past 35, and the city gets more than two metres of snow in an average winter. The good news is that the seasons are reliable and the city is built for them. This guide gives the official climate averages month by month, explains what the numbers feel like on the street, and tells you what to pack for each part of the year.
The figures come from Environment and Climate Change Canada (ECCC), Canada’s national weather service, for its station at Montréal–Trudeau airport (YUL). The main table uses the 1991–2020 climate normals; sunshine and the extra counts of hot, cold and stormy days use ECCC’s 1981–2010 normals. If you are still choosing dates, our guide to the best time to visit Montreal weighs the weather against festivals, prices and crowds.
Montreal Weather at a Glance
- Winter (December to March): cold, snowy and often bright. January is the coldest month, with an average daily mean of −9.2 °C and 52 cm of snow.
- Spring (April and May): fast and changeable. April starts with snowbanks and ends with the first warm afternoons; May averages 19 °C highs.
- Summer (June to August): warm to hot and humid, with thunderstorms. July averages 26.7 °C highs and is the sunniest month.
- Autumn (September to November): mild and colourful in September and October, grey and damp in November.
Montreal Weather by Month: The Climate Table
These are the averages for Montréal–Trudeau airport, the city’s official climate station. Temperatures, rain, snow and precipitation days are ECCC’s 1991–2020 normals; sunshine is the 1981–2010 normal. A “precipitation day” is one with at least 0.2 mm of rain or melted snow, and a “snow day” one with at least 0.2 cm of snow.
| Month | Daily high | Daily low | Daily mean | Rain (mm) | Snow (cm) | Precipitation days | Snow days | Sunshine (hours) |
|---|---|---|---|---|---|---|---|---|
| January | −5.0 °C | −13.5 °C | −9.2 °C | 32.8 | 52.0 | 17.1 | 15.4 | 101.2 |
| February | −3.4 °C | −12.4 °C | −8.0 °C | 16.9 | 47.1 | 13.7 | 12.4 | 127.8 |
| March | 2.4 °C | −6.5 °C | −2.0 °C | 37.3 | 37.1 | 13.7 | 9.0 | 164.3 |
| April | 11.3 °C | 1.1 °C | 6.2 °C | 74.9 | 14.8 | 12.4 | 3.0 | 178.3 |
| May | 19.4 °C | 8.3 °C | 13.9 °C | 85.6 | 0.0 | 13.8 | 0.0 | 228.9 |
| June | 24.2 °C | 13.8 °C | 19.0 °C | 83.6 | 0 | 12.9 | 0 | 240.3 |
| July | 26.7 °C | 16.7 °C | 21.7 °C | 91.2 | 0 | 12.8 | 0 | 271.5 |
| August | 25.7 °C | 15.6 °C | 20.6 °C | 93.6 | 0 | 11.2 | 0 | 246.3 |
| September | 21.1 °C | 10.9 °C | 16.0 °C | 89.2 | 0 | 11.3 | 0 | 182.2 |
| October | 13.2 °C | 4.5 °C | 8.9 °C | 101.6 | 1.1 | 13.5 | 0.6 | 143.5 |
| November | 6.1 °C | −1.7 °C | 2.3 °C | 67.4 | 16.3 | 14.3 | 4.8 | 83.6 |
| December | −1.2 °C | −8.7 °C | −5.0 °C | 44.2 | 48.2 | 16.8 | 12.8 | 83.6 |
| Year | 11.7 °C | 2.3 °C | 7.0 °C | 818.3 | 216.6 | 163.3 | 58.2 | 2,051.3 |
Reading the Numbers: The Wettest, Snowiest and Sunniest Months
Averages can mislead if you read them the wrong way. Here is what the table actually says.
The Coldest and Warmest Months
January is the coldest month, with a daily mean of −9.2 °C, and February is close behind at −8.0 °C. July is the warmest, with a daily mean of 21.7 °C and highs averaging 26.7 °C, followed by August. On average, the temperature stays at or below freezing all day on 74 days a year, most of them between December and February (1981–2010).
The Wettest Month
Montreal’s precipitation is spread fairly evenly through the year, at between about 77 and 103 mm in every month except February; there is no dry season. On the 1991–2020 normals, October is the wettest month, with 103.1 mm of total precipitation, almost all of it as rain. February is the driest, with 65.5 mm. If you are counting days rather than millimetres, December and January have the most days with precipitation, because light snow falls so often.
The Snowiest Month
January is the snowiest month, with 52.0 cm on average, followed by December (48.2 cm) and February (47.1 cm). March still averages 37.1 cm, and April 14.8 cm, so snow in early spring is normal. The annual average is 216.6 cm. On the 1981–2010 figures, there is at least 1 cm of snow on the ground on about 104 days a year, and a fall of 10 cm or more in a single day happens about five times a winter.
The Sunniest and Gloomiest Months
July is the sunniest month, with about 272 hours of bright sunshine, and the stretch from May to August is the brightest of the year. November and December are the dullest, at about 84 hours each. Winter is brighter than people expect: February and March, cold as they are, get more sunshine than November.
Montreal Weather Month by Month, and What to Wear
Here is what each month is like on the street, with the clothing that works. For the deep-winter kit list, see our guide to what to wear in Montreal in winter.
Montreal Weather in January
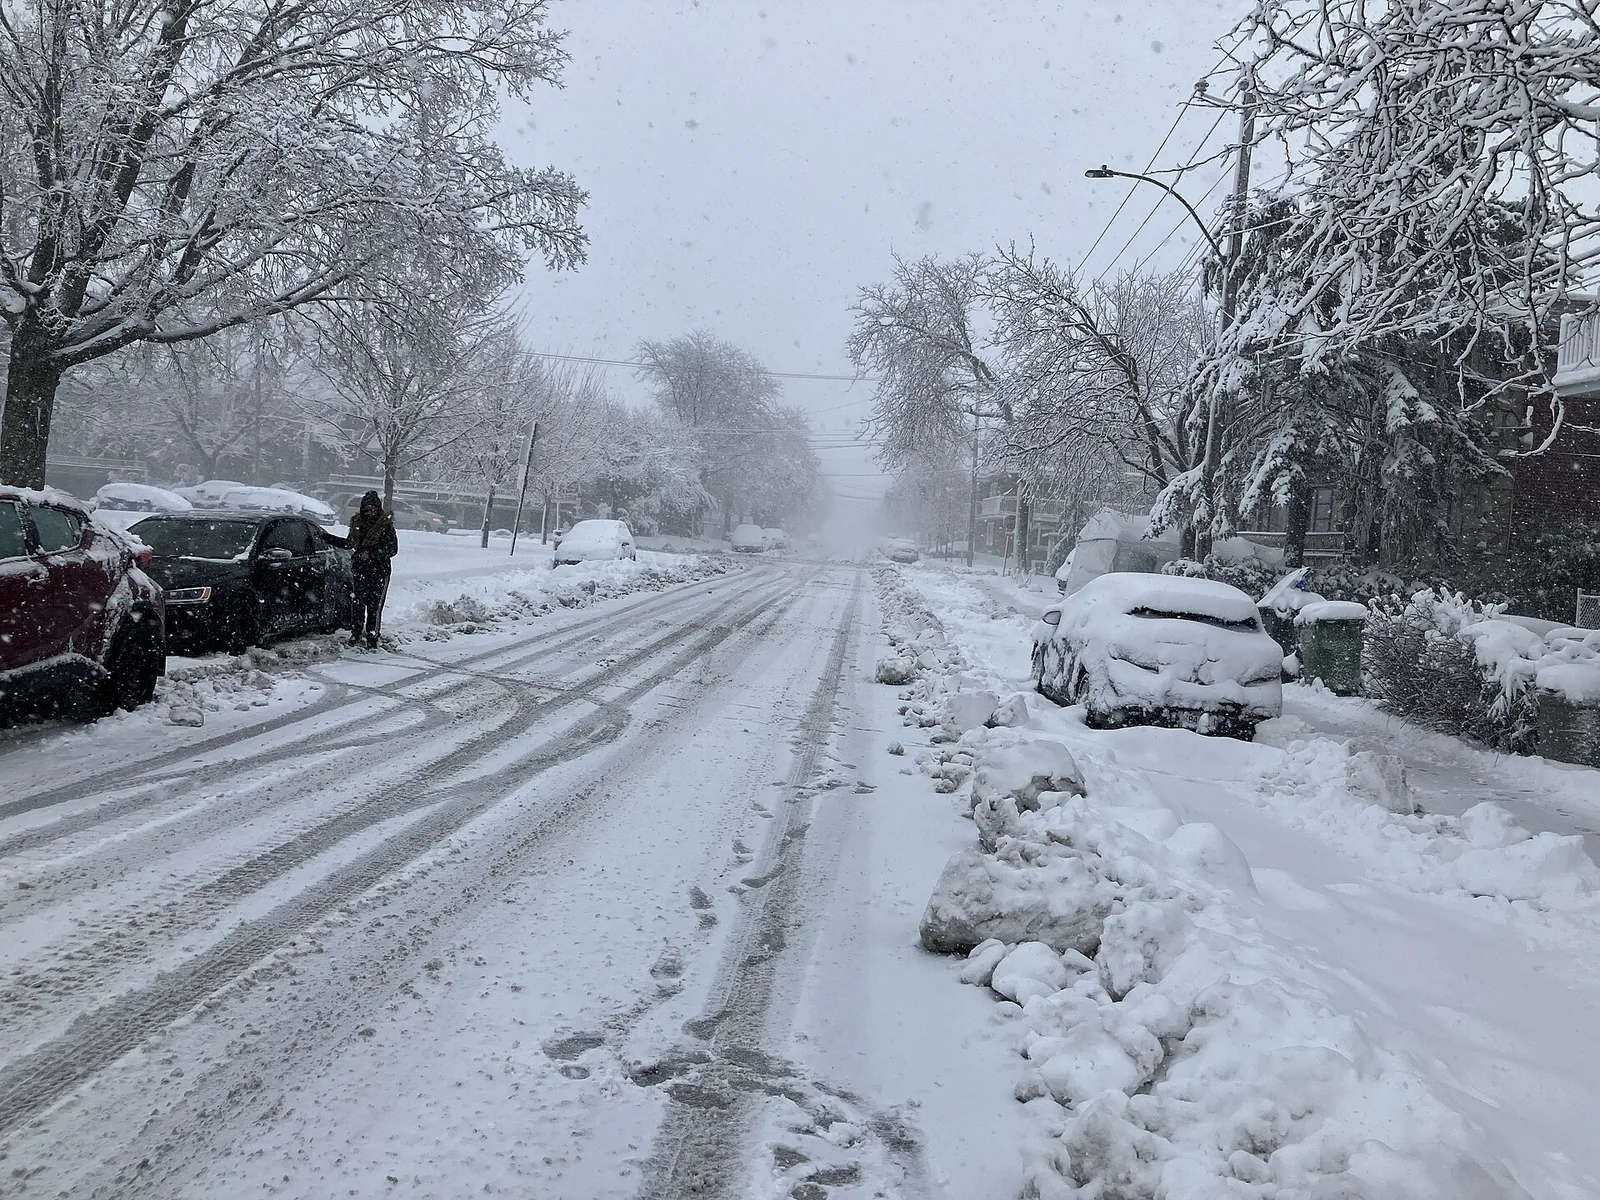
The heart of winter. Highs average −5 °C and lows −13.5 °C, and on the 1981–2010 figures there are about 17 days a month when the wind chill drops below −20. Snow falls on about 15 days, adding up to 52 cm, and cold snaps can be severe. The upside is that the cold is often dry and the sky blue, and the city is set up for it: outdoor rinks, Igloofest and the Underground City. Wear: a long insulated parka, insulated waterproof boots with grip, thermal base layers, a tuque, mitts and a scarf or neck warmer. Our Montreal in winter guide covers what to do.
Montreal Weather in February
Still very cold, with highs of −3.4 °C and lows of −12.4 °C, but the days are noticeably longer and brighter: February averages 128 hours of sunshine, against 101 in January. It is also the driest month by total precipitation. Montréal en Lumière runs from 18 to 28 February 2027. Wear: the same full winter kit as January, plus sunglasses for the glare off fresh snow.
Montreal Weather in March
The thaw begins, but slowly. Average highs creep above freezing (2.4 °C) while nights stay well below (−6.5 °C), so snow melts by day and freezes by night into ice and slush. March still averages 37 cm of snow. Sugar shack season starts in the countryside. Wear: waterproof boots are essential, plus a warm, water-resistant coat and layers you can open as the afternoon warms up.
Montreal Weather in April
The month of extremes. Average highs reach 11.3 °C, but April can bring both a T-shirt afternoon and a late snowfall (it averages 14.8 cm). The last of the snowbanks melt, the streets are muddy and the trees stay bare until late in the month. On ECCC’s 1981–2010 figures, the average last spring frost falls around the end of April. Wear: a waterproof jacket over layers, waterproof shoes and a warm hat for the evenings.
Montreal Weather in May
Spring arrives properly. Highs average 19.4 °C and lows 8.3 °C, the trees leaf out, and the terrasses (patios) open. Snow is essentially over. May is one of the most pleasant months for walking the city, though evenings can still be cool. Wear: a light jacket or sweater, comfortable walking shoes and a compact umbrella.
Montreal Weather in June
Early summer, with highs of 24.2 °C, long evenings and the start of the festival season. Humidity starts to build: on the 1981–2010 figures, the humidex reaches 30 or more on about nine days in June. Thunderstorms are common in summer afternoons. Wear: summer clothes, a light layer for the evening and air-conditioned interiors, and a rain jacket.
Montreal Weather in July
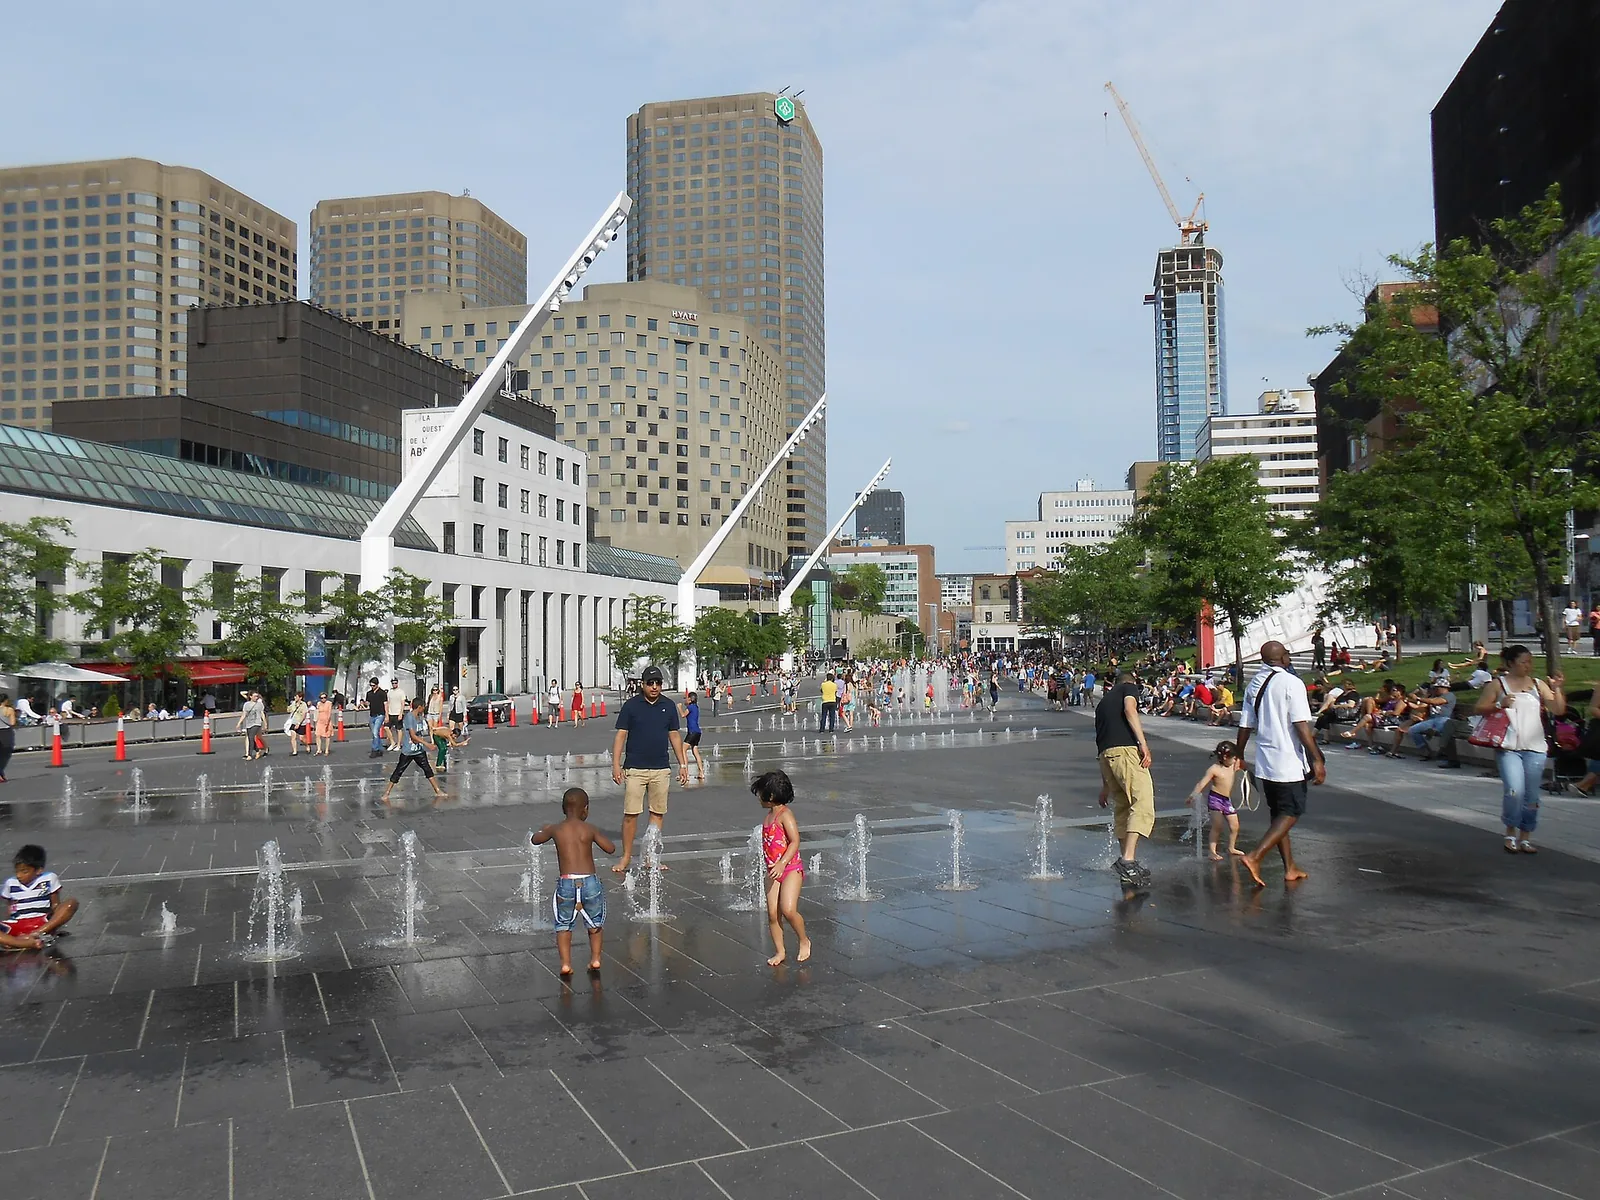
The warmest and sunniest month. Highs average 26.7 °C and lows 16.7 °C, with about 272 hours of sunshine. July is also the most humid: on the 1981–2010 figures, the humidex reaches 30 or more on about 17 days, and the temperature tops 30 °C on three or four days. Afternoon thunderstorms can be heavy. Wear: light, breathable clothes, a hat, sunscreen and a water bottle for festival days, plus a light layer for air-conditioned theatres and the metro.
Montreal Weather in August
Still hot, with highs of 25.7 °C, and August holds the highest humidex on record at the airport station. August is also one of the wetter months for rain, much of it in short, heavy downpours. Evenings start to cool in the second half of the month. Wear: as July, with a rain jacket handy.
Montreal Weather in September
One of the most comfortable months of the year. Highs average 21.1 °C and lows 10.9 °C, the humidity drops, and the city is busy but no longer sweltering. Warm days can still happen early in the month, and nights grow crisp by the end. Wear: layers: a T-shirt, a light sweater and a jacket for the evening.
Montreal Weather in October
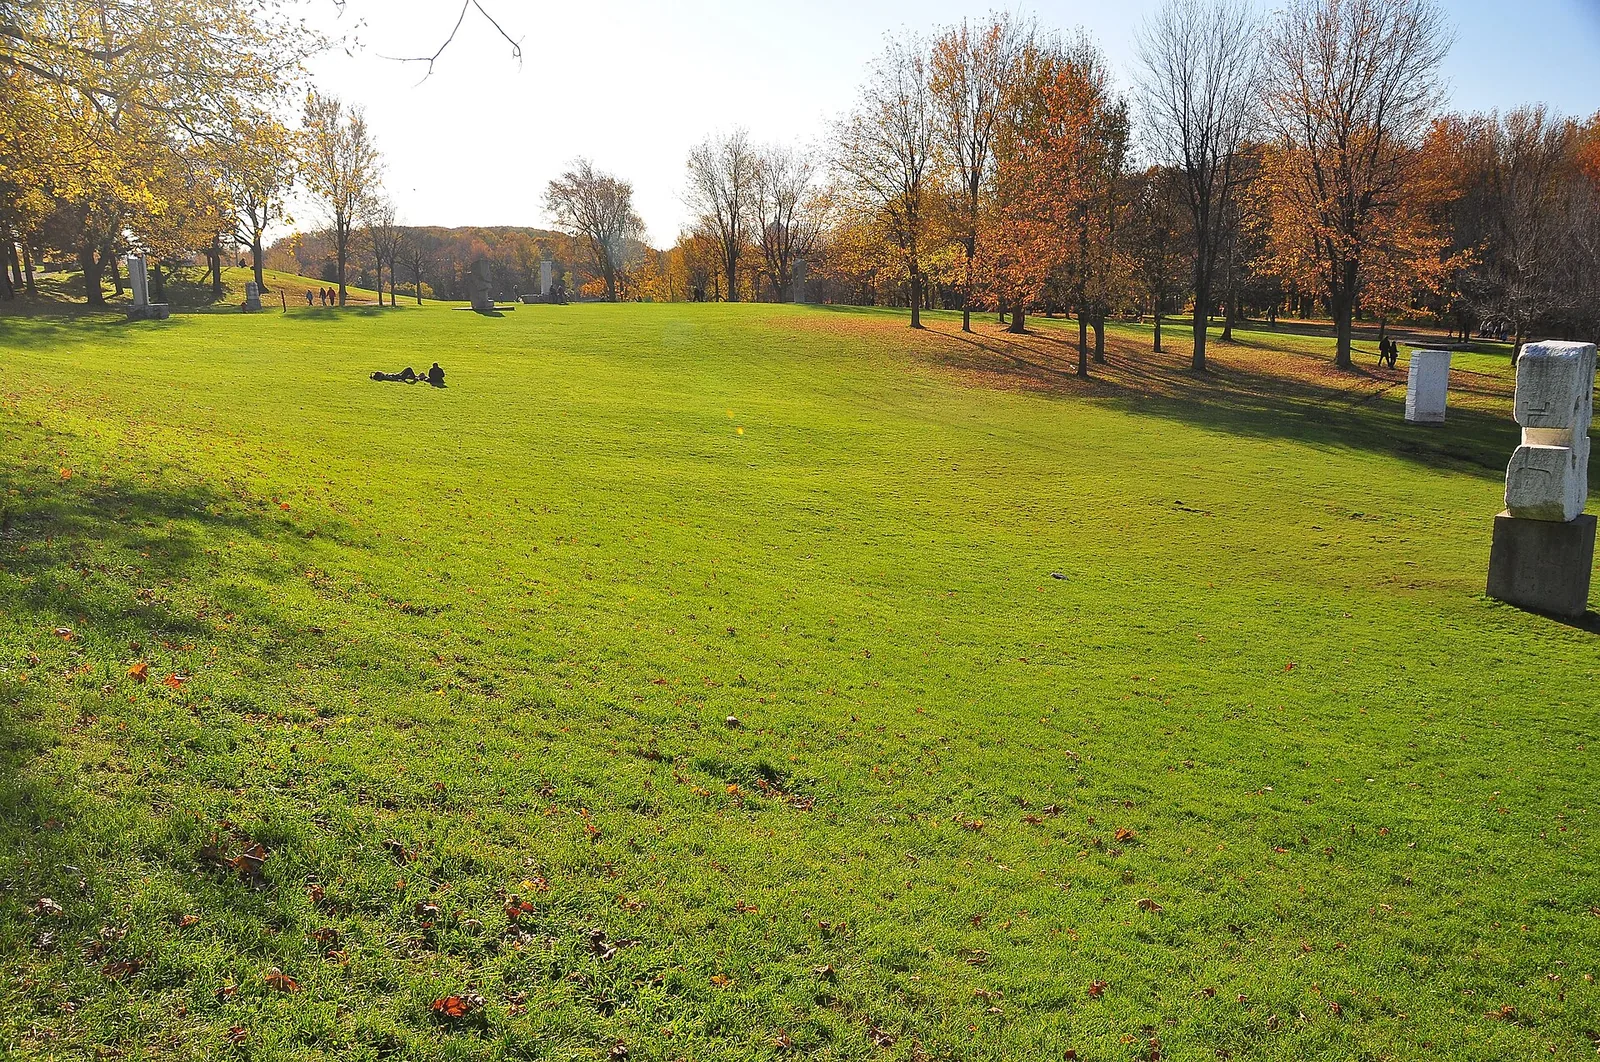
Autumn colour and cooler days. Highs average 13.2 °C and lows 4.5 °C, and on the 1991–2020 normals October is the wettest month of the year, with 103 mm. On ECCC’s 1981–2010 figures, the average first autumn frost falls around mid-October. A brief early flurry is possible. Wear: a warm, waterproof jacket, a sweater, closed shoes and a light hat and gloves for the evenings.
Montreal Weather in November
The grey month. Highs average 6.1 °C and lows −1.7 °C, sunshine drops to about 84 hours, and the first snow usually arrives as flurries (16.3 cm across the month). It is often damp, and dark by late afternoon once the clocks go back. Wear: a waterproof jacket with room for layers, waterproof shoes with grip, and a hat and gloves. Our Montreal in November guide covers the month in detail.
Montreal Weather in December
Winter settles in. Highs average −1.2 °C and lows −8.7 °C, snow falls on about 13 days (48.2 cm), and December has the most freezing-rain days of the year on the 1981–2010 figures. Snow on the ground for the holidays is likely but not guaranteed early in the month. Wear: full winter kit: an insulated coat, winter boots, a tuque and mitts. See Montreal in December for the month’s events.
Cold and Heat by the Numbers
Averages hide the days that shape a trip: the very cold mornings in January and the muggy afternoons in July. ECCC’s 1981–2010 normals count them.
| Measure (ECCC, 1981–2010) | Days a year | Peak months |
|---|---|---|
| High at or below 0 °C (freezing all day) | 74 | January (23), February (19), December (17) |
| Low below −20 °C | 14 | January (7.6), February (3.6) |
| Wind chill below −20 | 42 | January (17), February (12), December (8) |
| Wind chill below −30 | 9 | January (5) |
| High above 30 °C | 9 | July (3.6), August (2.5), June (2.2) |
| Humidex 30 or higher | 46 | July (17), August (14), June (9) |
| Humidex 35 or higher | 15 | July (6) |
| Freezing rain or drizzle | About 11 | December (3.5), January to March (about 2 each) |
| At least 1 cm of snow on the ground | 104 | December to March |
Wind Chill, Explained
Wind chill describes how cold the air feels on exposed skin when the wind blows. Canada’s weather service only reports it when the temperature is 0 °C or below and the wind is at least 5 km/h. It does not make objects colder than the air, but it does make frostbite happen faster. ECCC’s risk bands are:
| Wind chill | Risk | What it means |
|---|---|---|
| 0 to −9 | Low | Slight increase in discomfort |
| −10 to −27 | Moderate | Risk of hypothermia and frostbite after long exposure without protection |
| −28 to −39 | High | Exposed skin can freeze in 10 to 30 minutes |
| −40 to −47 | Very high | Exposed skin can freeze in 5 to 10 minutes |
| −48 to −54 | Severe | Exposed skin can freeze in 2 to 5 minutes |
| −55 and colder | Extreme | Exposed skin can freeze in less than 2 minutes |
Montreal’s records for the airport station include wind chills below −45 in January, February and December. On those days, cover your face, keep outdoor walks short and use the metro and the Underground City.
Humidex, Explained
Humidex is the summer equivalent: it combines temperature and humidity to describe how hot it feels. ECCC’s guidance is that a humidex of 20 to 29 means little discomfort, 30 to 39 some discomfort, 40 to 45 great discomfort (avoid exertion), and above 45 is dangerous, with heat stroke possible. Above 30, limit or adjust outdoor exercise; above 40, cut unnecessary activity. The highest humidex values recorded at the airport station reach 45 or more in June, July and August. On festival days in July, drink water often and find shade in the afternoon.
Weather Hazards: Freezing Rain, Snowstorms and Heat
Montreal’s weather is rarely dangerous for a visitor who plans around it, but three situations deserve respect.
Freezing Rain
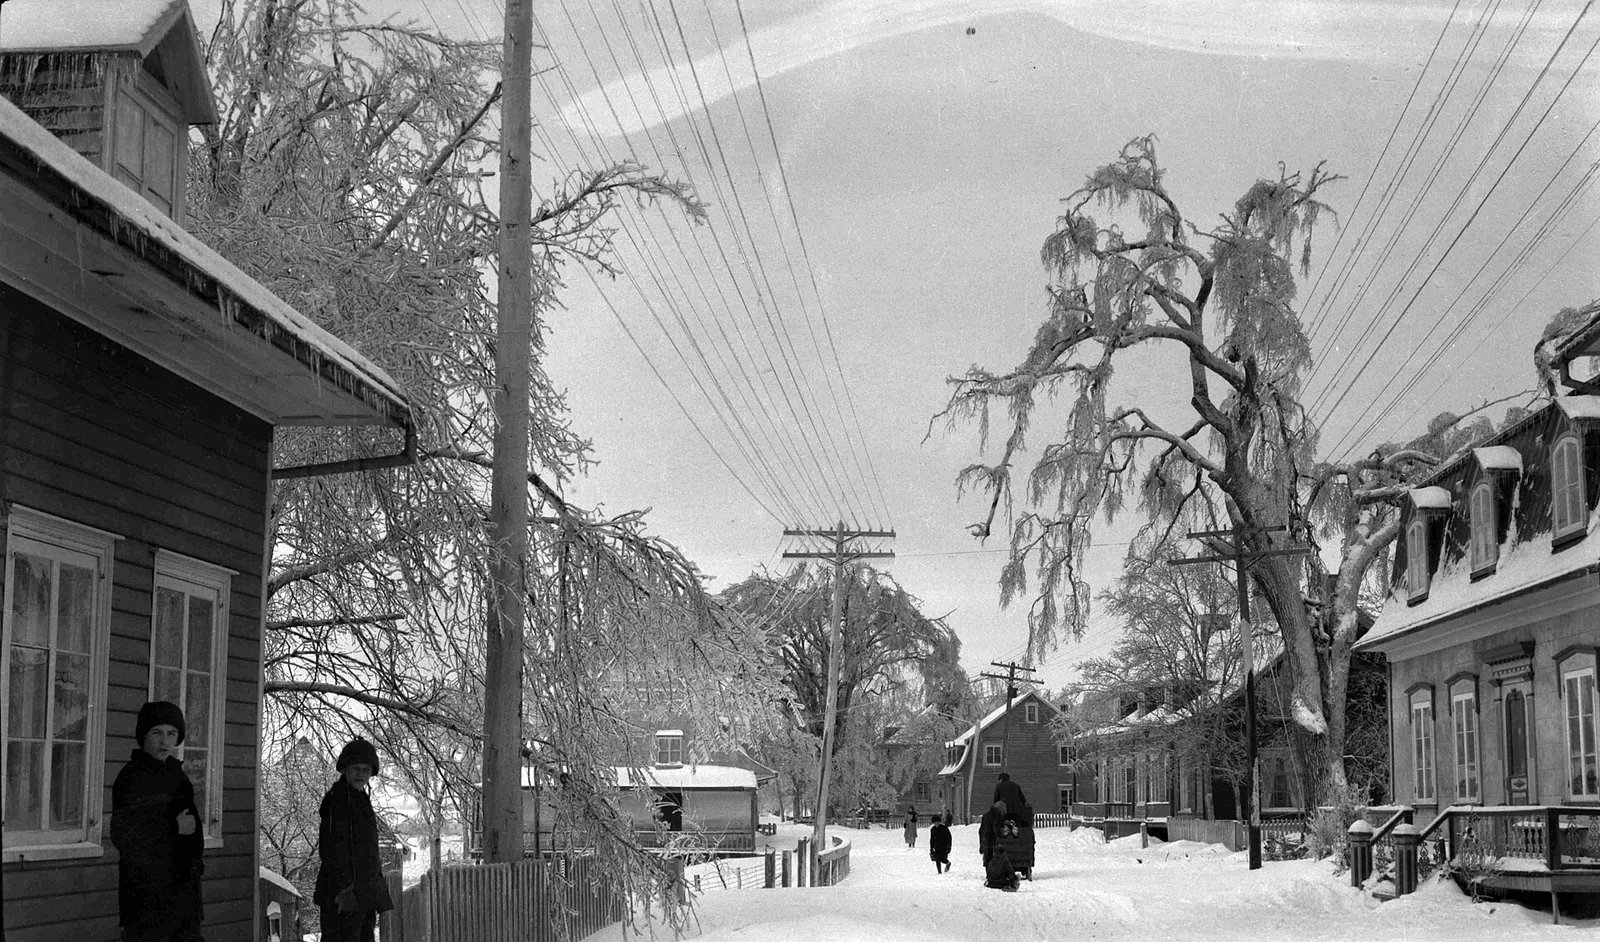
Freezing rain falls as rain and freezes on contact, coating sidewalks, steps and cars in clear ice. It is most common from December to March. It is far more slippery than snow, so on freezing-rain days wear boots with good grip, walk slowly, use handrails and expect transport delays. Ice can also bring down branches and power lines.
The 1998 Ice Storm
The most famous weather event in Montreal’s modern history was the ice storm of January 1998, a run of five successive ice storms from 4 to 10 January that hit eastern Ontario, southern Quebec and parts of the Maritimes and the northeastern United States. At its peak, about four million people lost power, and at least 25 deaths in Canada were attributed to it. On Mount Royal, about 5,000 trees had to be cut down and most of the rest were damaged. It remains the benchmark every Montrealer uses for bad winter weather.
Snowstorms
Big snowfalls are routine, and the city clears them efficiently, but a storm day changes your plans: buses run slower, sidewalks are narrow and slushy, and flights can be delayed. After big storms the city runs snow-removal operations, and parking rules change on the streets being cleared. If you are driving, read the parking signs carefully and check montreal.ca for snow-removal notices before you park.
Heat Waves
In summer, ECCC issues heat warnings based on the expected impact of the heat rather than a single temperature, and they usually come with high humidex values. On those days, plan indoor time in the afternoon, carry water and use air-conditioned museums, malls and the metro. Public pools and splash pads are a local way to cool off.
More About Montreal’s Climate
A few other measures help explain why the same temperature can feel so different from one season to the next.
Humidity
Montreal’s air is driest, relative to its temperature, in spring. On ECCC’s 1991–2020 figures, afternoon relative humidity (measured at 15:00) averages about 50% in April and May, rises to the mid-50s in summer, and climbs to about 68% in January and 72% in December. Summer feels muggier than those numbers suggest because warm air holds far more moisture than cold air, which is what the humidex measures. Winter’s higher relative humidity is part of why damp cold in November and December feels raw.
Wind
The average hourly wind speed at the airport is 14.4 km/h over the year (1981–2010), strongest in January at about 16 km/h and lightest in August at about 12 km/h. That winter breeze is what turns a −15 °C morning into a wind chill in the −20s. Open spaces, the Old Port waterfront and the Kondiaronk Belvedere on Mount Royal feel windier than sheltered downtown streets.
Thunderstorms and Fog
Summer storms are common: on ECCC’s 1981–2010 figures, the airport station logs thunder on about five days a month from June to August. They usually come in the afternoon or evening and pass quickly, so they rarely spoil a whole day, but outdoor festival stages can pause for lightning. Fog is less of a feature, at about 15 days a year.
Frost Dates
On ECCC’s 1981–2010 figures for the airport, the average last spring frost falls around the end of April and the average first autumn frost around mid-October, leaving about 165 frost-free days. That is why the terrasses, gardens and outdoor markets come into their own from May to early October.
Matching Your Plans to the Weather
The best way to use Montreal’s climate is to plan around it rather than fight it.
- Outdoor skating: December to February, when the temperature stays below freezing all day on most days. Our ice skating guide lists the rinks.
- Snow and winter festivals: January and February, the snowiest and coldest stretch, with Igloofest and Montréal en Lumière (18 to 28 February 2027).
- Walking tours and long city days: May, June and September, when highs sit around 19 to 24 °C.
- Outdoor festivals and patios: June to August, when evenings are warm and long. See our festivals guide.
- Autumn colour on Mount Royal: October. Our Mount Royal guide has the walking routes.
- Museums and restaurants: November and March, when the weather pushes everyone indoors.
How to Check the Forecast and Weather Alerts
Check the official forecast from Environment and Climate Change Canada a few days before you travel and each morning while you are in Montreal. ECCC’s forecasts and public weather alerts are free on its website and in the WeatherCAN app. Its alerts are based on impact: ECCC’s Weather Impact Guides describe what heat, ice, snowfall, snow squalls and blizzards are likely to do, from travel delays to power outages, rather than relying on a single number.
- Look at the “feels like” figure (wind chill or humidex), not just the temperature.
- Watch for freezing-rain warnings in winter; they matter more than snow for getting around.
- Check flight status on storm days; see our Montreal airport guide for getting to and from YUL.
- Plan indoor backups. The Underground City, the museums and the metro keep you moving whatever the weather. Our getting around guide explains fares.
Packing for Montreal Weather, Season by Season
| Season | Typical weather | Pack |
|---|---|---|
| Winter (Dec–Mar) | Highs below freezing in Dec–Feb, lows around −9 to −14 °C, frequent snow, occasional freezing rain | Insulated parka, winter boots with grip, thermals, tuque, mitts, scarf |
| Spring (Apr–May) | Highs 11 to 19 °C, late snow possible in April, rain | Waterproof jacket, layers, waterproof shoes, light hat and gloves |
| Summer (Jun–Aug) | Highs 24 to 27 °C, humid, afternoon thunderstorms | Light clothes, sun hat, sunscreen, rain jacket, light layer for air conditioning |
| Autumn (Sep–Nov) | Highs 21 °C falling to 6 °C, wettest in October, grey in November | Layers, waterproof jacket, closed shoes; hat and gloves by November |
Whatever the season, layers beat one heavy garment: buildings, the metro and shops are well heated in winter and air-conditioned in summer. For more practical advice, see our Montreal travel tips, and for the year-round calendar, our Montreal events guide.
Frequently Asked Questions
What is the coldest month in Montreal?
January. On Environment and Climate Change Canada’s 1991–2020 normals for Montréal–Trudeau, January has a daily mean of −9.2 °C, with average highs of −5.0 °C and lows of −13.5 °C. February is almost as cold. Wind chill makes it feel colder: on the 1981–2010 figures, January averages about 17 days with a wind chill below −20.
How much snow does Montreal get?
About 216.6 cm a year on ECCC’s 1991–2020 normals. January is the snowiest month (52.0 cm), followed by December (48.2 cm) and February (47.1 cm), and snow is common until March and possible in April. On the 1981–2010 figures, the ground has at least 1 cm of snow on about 104 days a year.
What is the hottest month in Montreal?
July, with average highs of 26.7 °C and a daily mean of 21.7 °C on the 1991–2020 normals. It is also the most humid month: on the 1981–2010 figures, the humidex reaches 30 or more on about 17 days in July. August is a close second. Afternoon thunderstorms are common in both months.
What is the rainiest month in Montreal?
On the 1991–2020 normals, October has the most precipitation, at 103.1 mm, almost all of it rain. But Montreal’s precipitation is spread fairly evenly, with every month except February between about 77 and 103 mm, and December and January have the most days with precipitation because light snow falls so often. February is the driest month.
What is the best month for weather in Montreal?
For warm, comfortable weather, June and September are the best balance: highs of 21 to 24 °C, less humidity than July and August, and long or still-bright days. May and early October are pleasant but cooler. If you want snow and winter activities, January and February have the most reliable cold and snow.
What is wind chill, and how cold does it get?
Wind chill describes how cold the air feels on exposed skin when the wind blows. Environment Canada rates −28 to −39 as high risk, when exposed skin can freeze in 10 to 30 minutes, and −40 to −47 as very high risk, at 5 to 10 minutes. Wind chills below −45 have been recorded at Montreal’s airport in December, January and February.
Does Montreal get freezing rain?
Yes. On ECCC’s 1981–2010 figures, the airport station records freezing rain or drizzle on about 11 days a year, mostly from December to March. It coats sidewalks and steps in clear ice, so wear boots with good grip and walk carefully. The ice storm of January 1998 is the most severe example in modern memory.